How to Debug Proxy Issues with chrome://net-internals?
 Written
By
Puspendra Kumar
Written
By
Puspendra Kumar
Reading time: 4 minutes
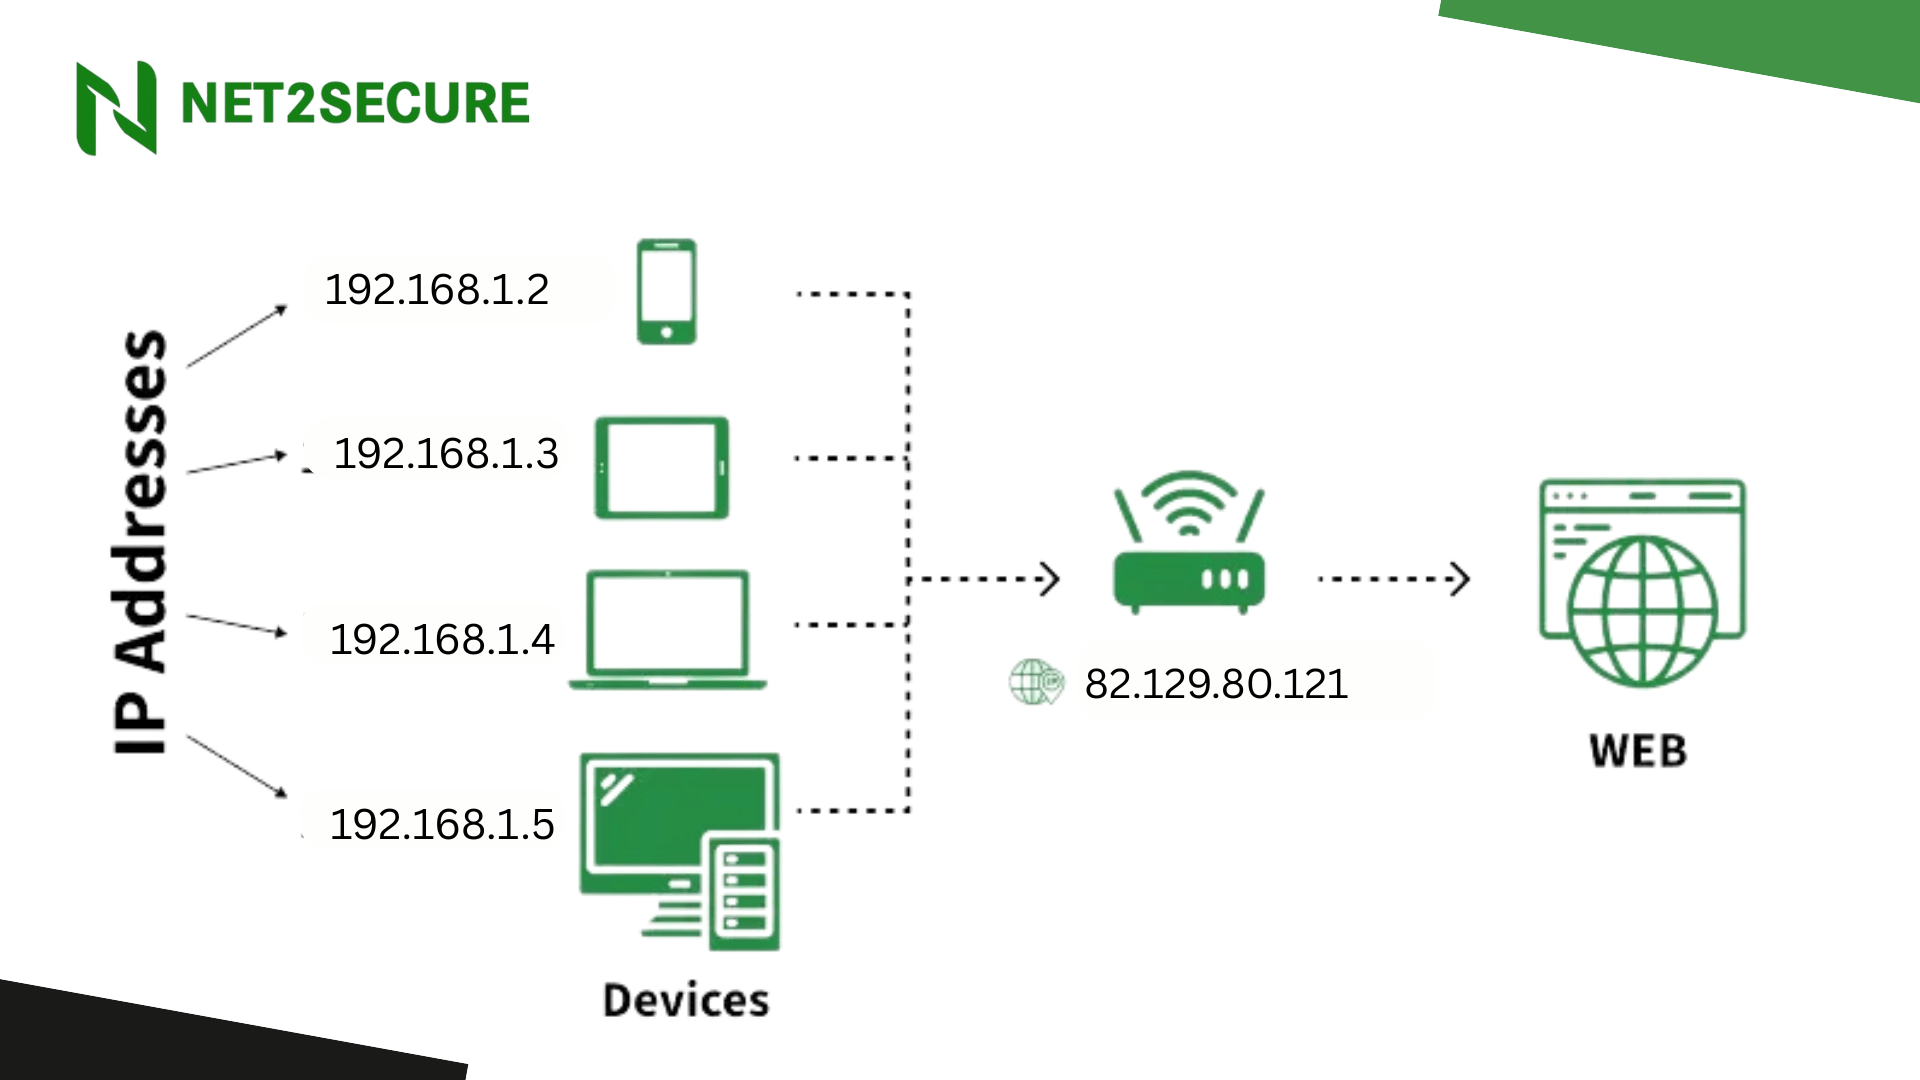
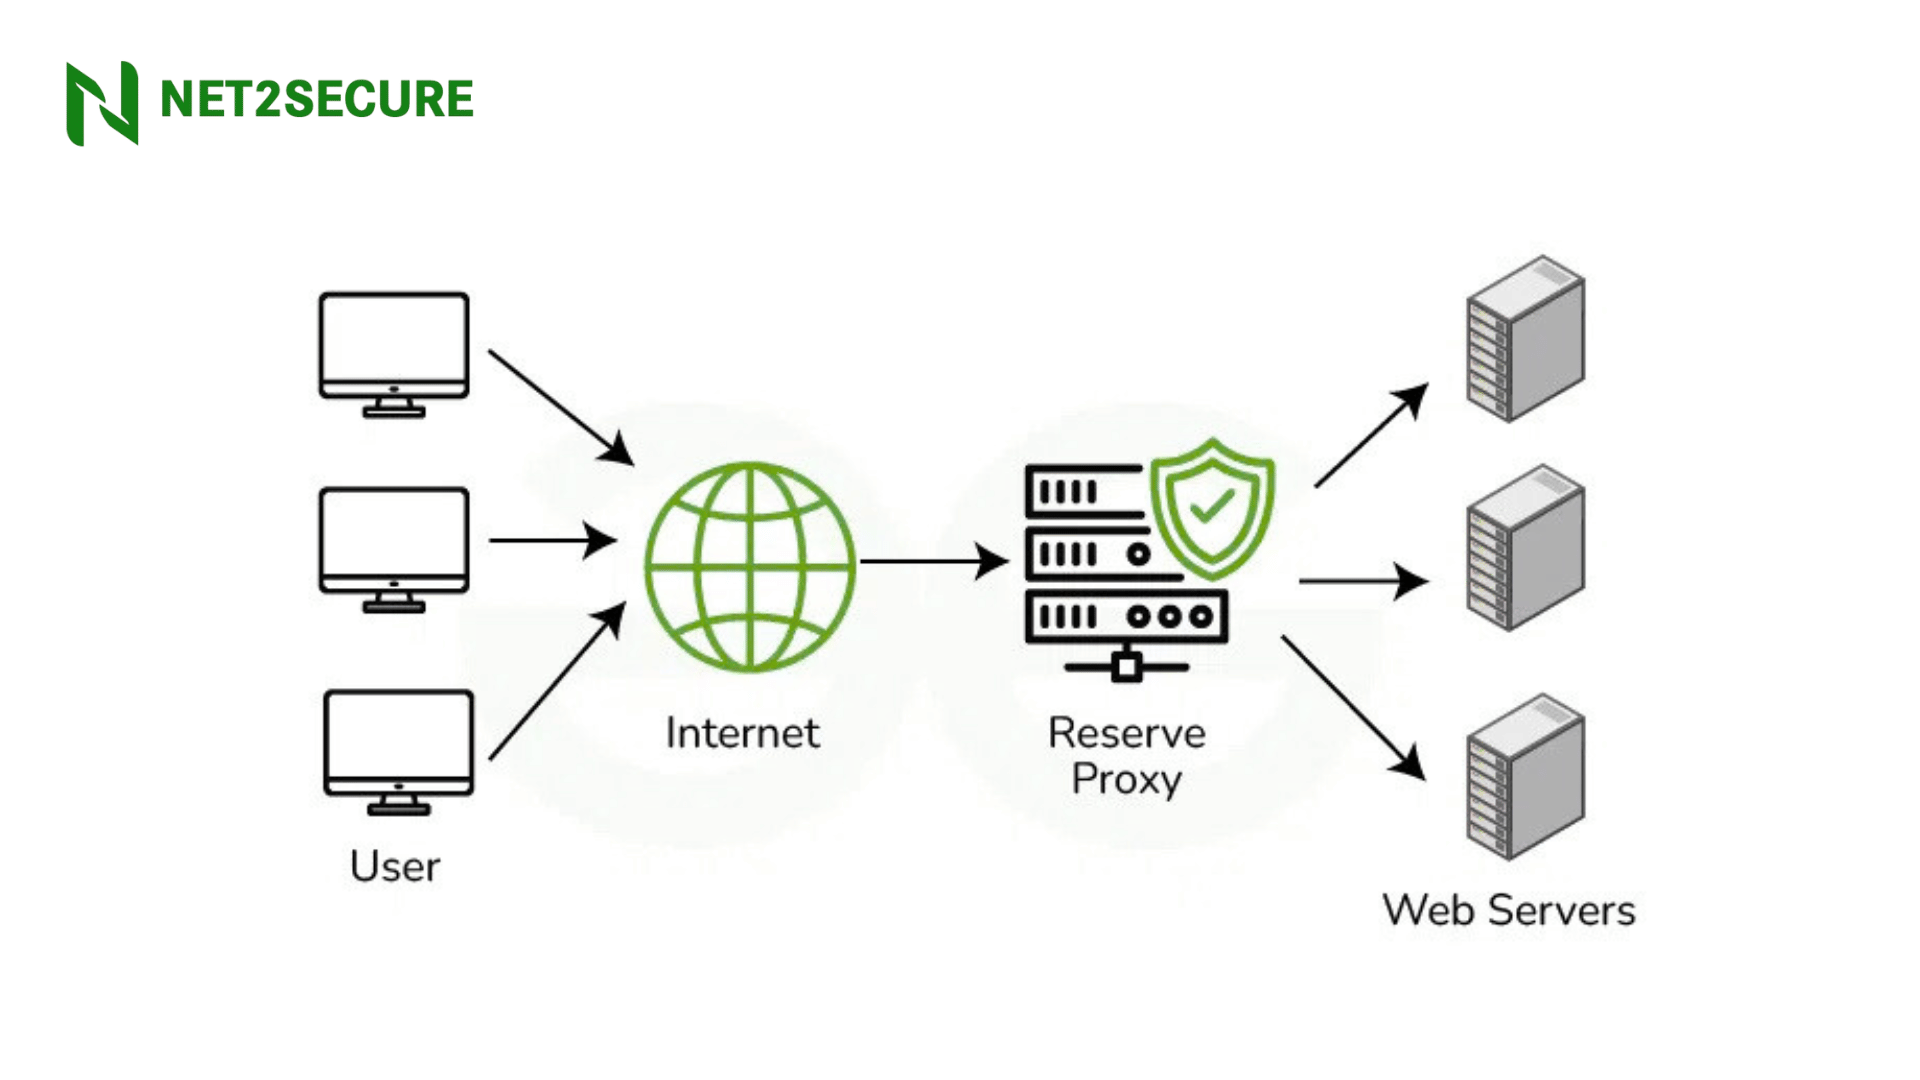
Proxy servers play a vital role in handling and protecting internet traffic by working as a mediator between a user’s browser and the web. Incorrect proxy configuration or network changes can lead to connectivity issues, slow browser performance, or limited access to websites.
When using Google Chrome, an effective built-in diagnostic tool known as chrome://net-internals enables users and IT professionals to debug proxy issues systematically and effectively. This post goes through the entire process of troubleshooting proxy-related issues using Chrome’s net-internals interface, helping users to restore reliable internet connectivity on Net2Secure Cloud-powered environments.
Chrome://net-internals- What is it?
Chrome Net Internals refers to a complete dashboard within Google Chrome that offers detailed insights into network activity, connection attempts, event logs, and proxy settings in real-time. However, primarily designed for developers and modern users, anyone facing proxy-related connectivity issues can benefit from this tool to analyze the issue at a granular level.
How to Access Proxy Debugging Features in Chrome Net Internals?
Firstly, open Google Chrome on your device. In the address bar, type chrome://net-internals and press Enter. This redirects you to the Chrome Net Internals dashboard. Navigate to the Proxy section from the sidebar or directly access with chrome://net-internals/#proxy. This tab reveals current proxy configurations, whether Chrome is using a system-wide proxy, manual proxy settings, or direct connections with no proxy involved.
What Data Net-Internals Contains?
Chrome://net-internals offers a view of browser activity from net/’s perspective. Due to this reason, it lacks knowledge of tabs, navigation, frames, resource types, etc. A list of views is shown in the leftmost column. This document just addresses the Events view, which is used for the majority of troubleshooting.
The URLRequestContext is the top-level network stack object. All Chrome URLRequestContexts connected to the single, global NetLog object are included in the Events view. This covers, among other things, both incognito and non-incognito profiles. The Events view is updated incrementally as events happen and only displays events for the time that net-internals was operational.
In an attempt to help debug stalled requests, the code adds a top-level event for URLRequests that were active when the chrome://net-internals tab was opened. However, this is merely a best-effort solution and only covers requests for the system URLRequestContext and the current profile.
Understanding Proxy Configurations Displayed
The Proxy tab shows the active proxy mode and relevant details like
The proxy server address and port if a manual proxy is set.
System proxy usage status.
Whether a Proxy Auto-Config (PAC) script is in use. This quick visibility helps in finding obvious misconfigurations like wrong IP addresses, ports, or missing PAC URL settings.
Steps to Debug Common Proxy Issues
Here are general proxy concerns and how Chrome Net Internals assist in addressing them:
-
Wrong Proxy Settings: If the proxy IP address or port is incorrectly configured, Chrome will fail to connect through that proxy. Use the Proxy tab to confirm values. If wrong, navigate to chrome://settings >system> open your computer proxy settings and correct them.
-
PAC Script Errors: Chrome calculates PAC scripts, Proxy Auto-Config JavaScript, to fix how to route internet traffic. Net Internals logs PAC calculation events and errors, visible under the Proxy_Script_Decider event. Errors here could block proper proxy routing. You can also use the Reapply settings button on the Proxy tab to reload the PAC script.
-
Authentication Failures: Certain proxies need to be authenticated. Network queries may be rejected if credentials are missing or inaccurate. For smooth connectivity, check proxy authentication settings outside of Chrome and make any required updates.
-
Firewall or Security Software Blocking: Firewall rules or antivirus software might block connections to the proxy server, causing failures. Check that Chrome is enabled through firewall settings and that no security tools are restricting proxy communication.
-
Bypass Proxy for Local Addresses: Local network addresses should occasionally avoid using the proxy in order to prevent needless traffic routing. If necessary, make sure your proxy setup includes local LAN address exceptions.


.png)